Measuring and displaying Azimuth and Elevation values
On the microwave bands it is crusial to point the antenna in azimuth as precise as possible in a given direction. On the high microwave bands also the elevation angle of the antenna is important. For that purpose the development of a cheap and open system for displaying azimuth and elevation values of an antenna system was started. The accuracy should be at least sufficient for tropospheric microwave use.
A solution was using Arduino boards and Arduino code to promote the open software ideas. The results of the development is a range of software and hardwaremodules which can be used for HF, VHF, Microwaves and EME antenna systems.
Displaying azimuth and elevation values measured with potentiometers
Schematic of an Arduino measuring and displaying azimuth and elevation values. Click on the picture to enlarge
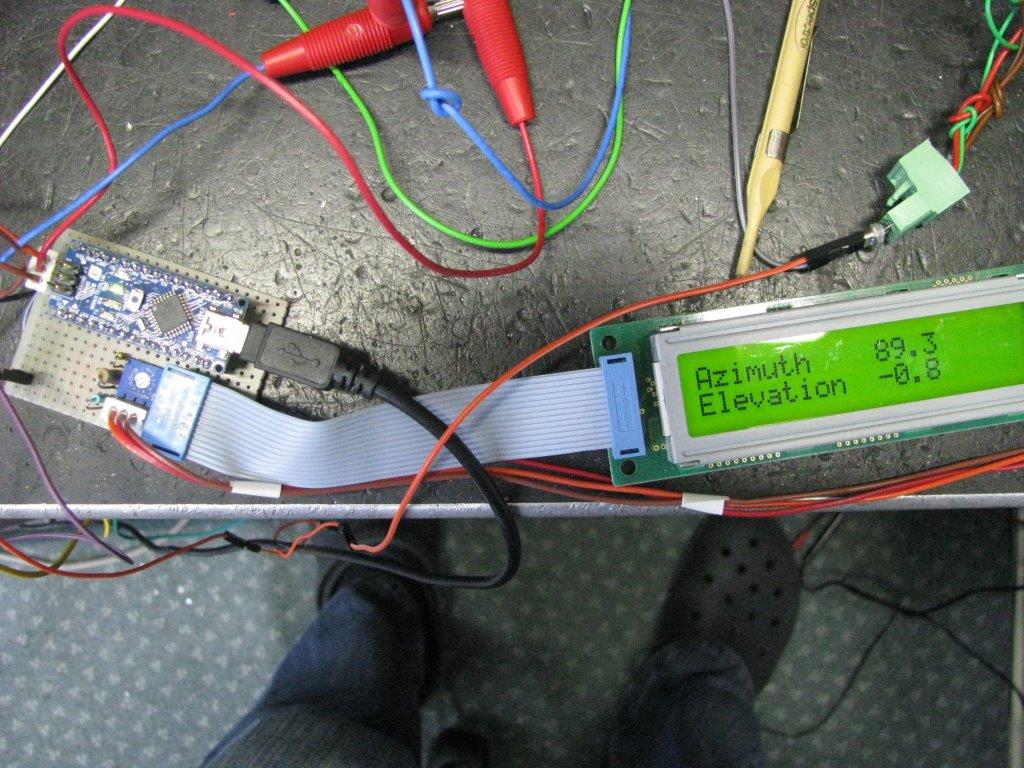
The most simple solution is to measure the azimuth and/or elevation values with a potentiometer. The potentiometer value is read by the analog input of an Arduino and converted to degrees. For azimuth and elevation calibration a gear factor has to be put into the program. The remaining offsets will be set by push buttons; this enables also portable use. A software setting permits to use the display for azimuth or elevation only or for displaying both. An other software setting is the displayed accuracy. Azimuth and elevation display accuracy can be set indepenent to one degree, .5 degree or to .1 degree. Display refresh frequency and low-pass filtering are easily to adapt.

Click to enlarge
A prototype is shown on the photograph; the azimuth accuracy is set to .5 degree and the elevation to 1 degree. For azimuth the range is from 0 to 360 degrees; for azimuth the range is from -90 to 270 degrees.
A display unit with remote sensor boards
Overview diagram. The remote sensorboards are coupled with the display unit via a RS485 connection. Click on the picture to enlarge
In most cases the antenna system is outside and the display unit is in the shack. To enable a relative long cable (up to 100 meters and more) between antenna sensor(s) and display unit the connection between them is made via RS485. Dependent on specific situations one or two RS485 signals can feed the display unit; e.g. a separate cable for azimuth and for elevation.
The following sensor boards are supported with software:
— HW_sensorboard_analog. This board can be used for one or two potentiometers reading azimuth and/or elevation.
— HW_sensorboard_HH12. This board supports one or two 12 bit encoders MAB25 or HH-12 reading azimuth and/or elevation.
— HW_sensorboard_MPU6050. This board suports a (mems) sensor (MPU6050) for measuring elevation and a 12 bit encoder MAB25 or HH-12 for reading azimuth.

Schematic of the display unit. The difference between the two schematics is only an ‘and’ for the two RS485 signals (made up with 2 nand ports) – Click on the picture to enlarge
The software for the display units with one or two RS485 inputs is the same. But it is recommanded (not realy needed but the calibration is more precise) to use different software when interfacing analog or digital sensor boards. Therefore two different software packages for the display unit are available:
— SW_display_analog. This software package for the display unit has to be used in combination with HW_sensorboard_analog.
— SW_display_digital. This software package for the display unit has to be used in combination with: HW_sensorboard_HH12 or HW_sensorboard_MPU6050
The sensor boards in more detail
1) HW_sensorboard_analog
One or two potentiometers for measuring azimuth and/or elevation may be connected to this board. After processing 12 bit information will be sent out to the RS485 port. The software can easily be configured that azimuth and elevation data will be sent or only azimuth or elevation data.

Schematic of HW_sensorboard_analog. Click on the picture to enlarge
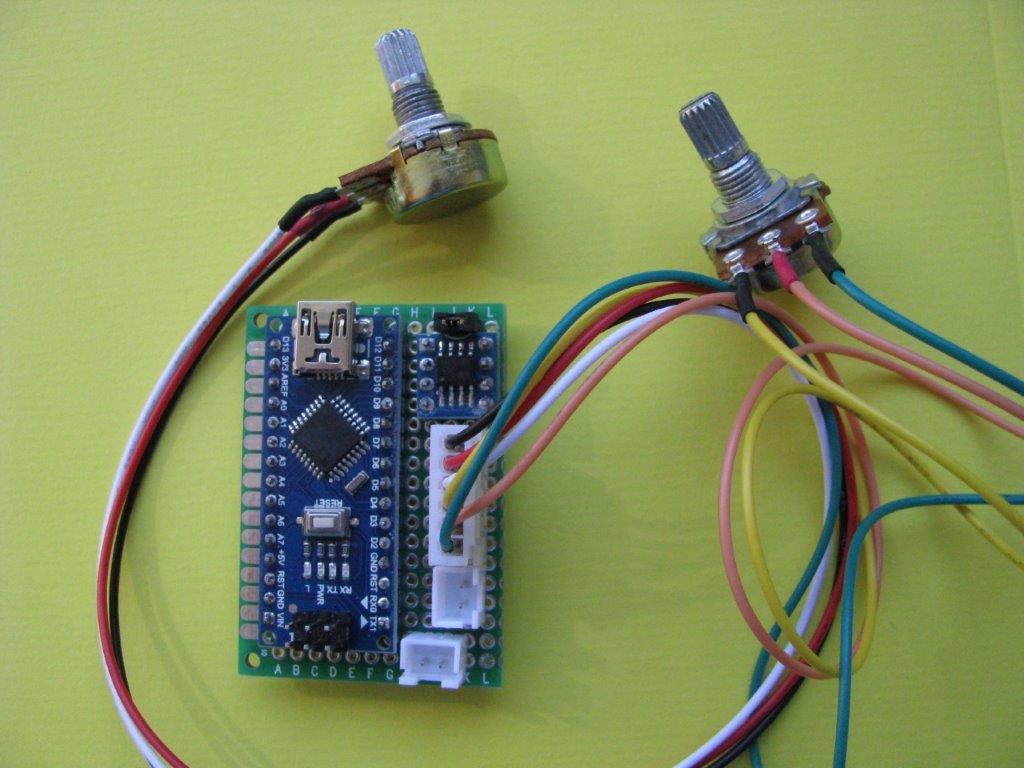
Photo HW_sensorboard_analog. Click on the photo to enlarge
2) HW_sensorboard_HH12
One or two 12 bits encoders MAB25 or HH-12 for measuring azimuth and/or elevation may be connected to this board. The 12 bit information will be sent out, without processing, to the RS485 port. The software can easily be configured that azimuth and elevation data will be sent or only azimuth or elevation data.
Schematic of HW_sensorboard_HH12. Click on the drawing to enlarge
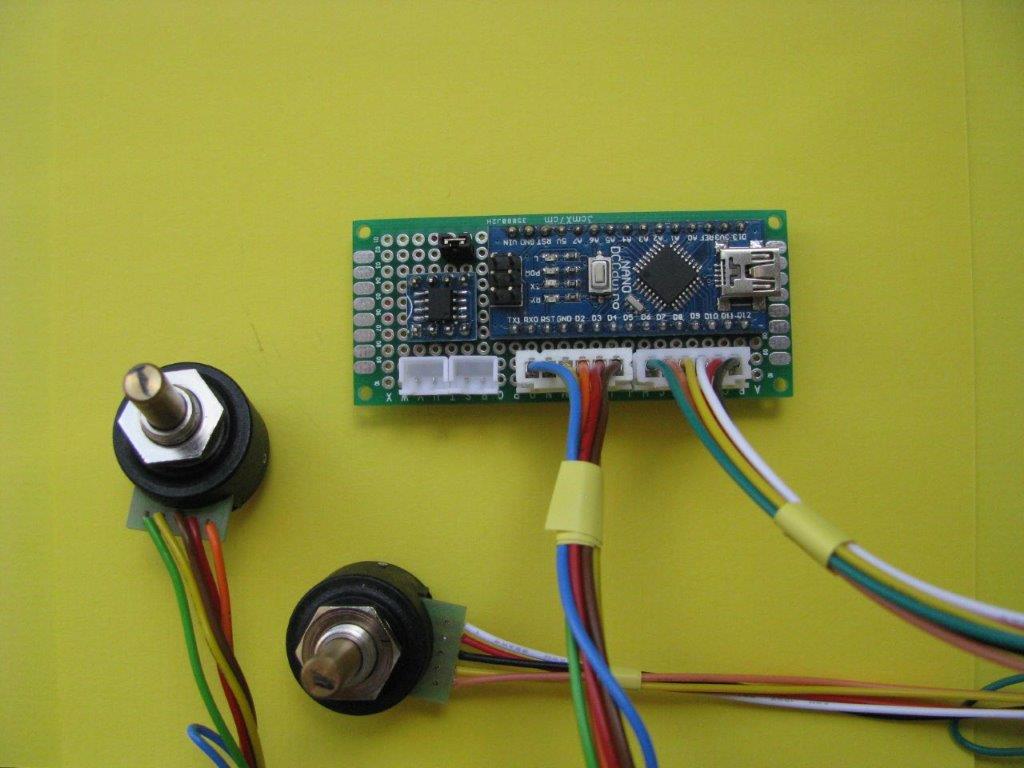
Photo of HW_sensorboard_HH12 with two HH-12 encoders. — Click on the photo to enlarge
A photograph of a prototype HW_sensorboard_HH12.
An Arduino Nano is used. If the board is used for azimuth or elevation only; simple remove the connector with one HH-12. Note: This board with the software is used by Harke, PA0HRK for his EME tracking system see: http://parac.eu/projectpaohrk-1.htm
3) HW_sensorboard_MPU6050
The schematic of this sensorboard is easy. If there is no need for an azimuth sensor don’t wire the HH-12/MAB25
Schematic HW_sensorboard_MPU6050 click on the picture to enlarge
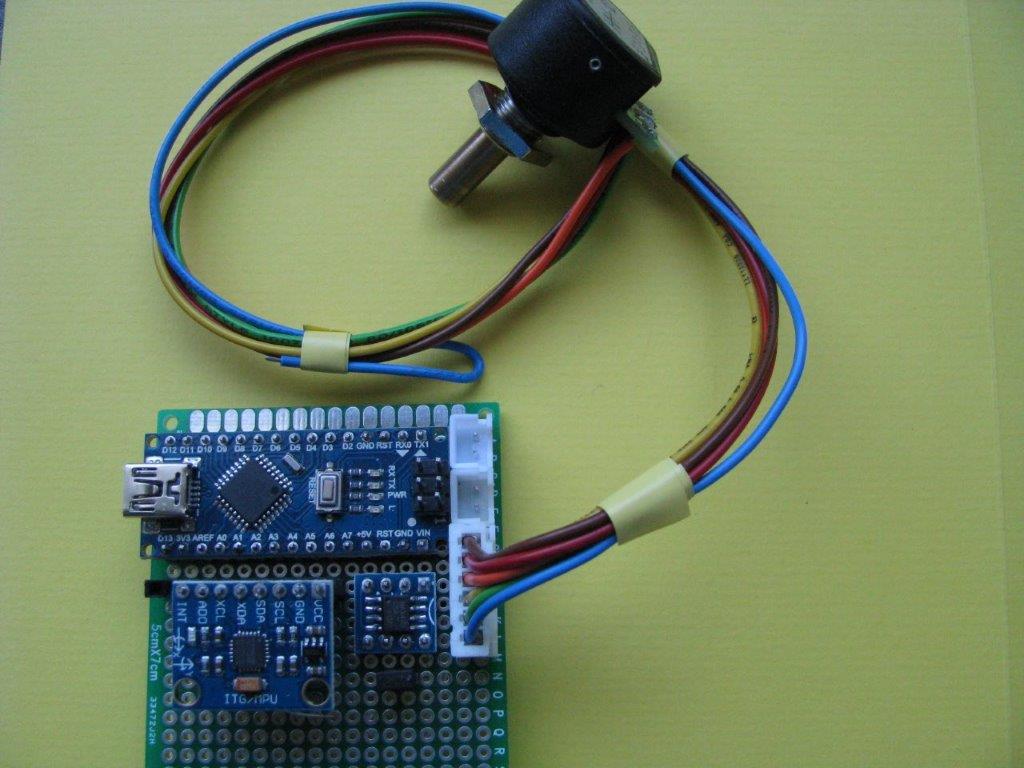
Photo of prototype HW_sensorboard_MPU6050 Click on the photo to enlarge
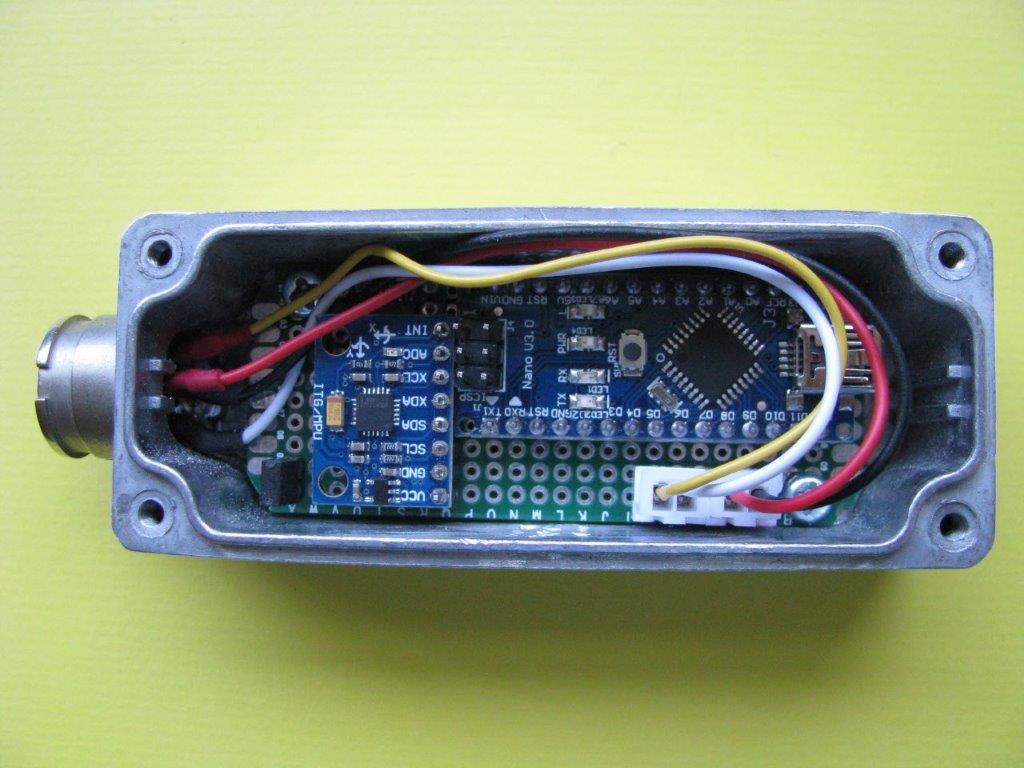
Photo of the elevation sensor in a final case. Click on the photo to enlarge
Calibration of the MPU6050
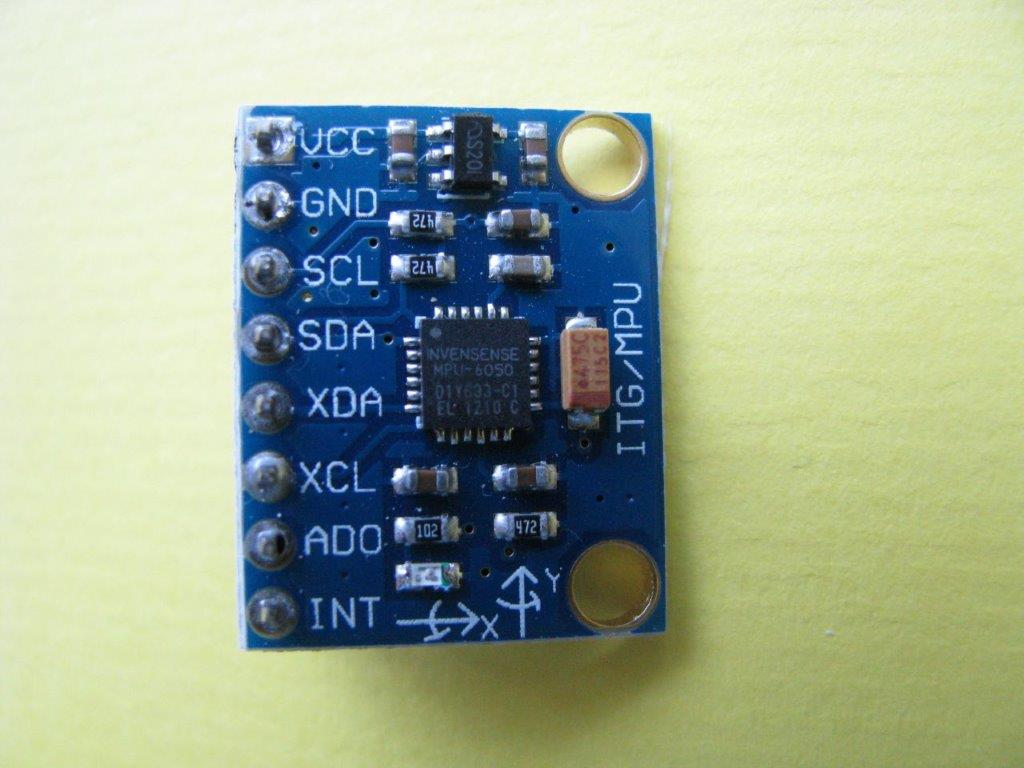
MPU6050 board. Click on the photo to enlarge
For good results the MPU6050 board has to be calibrated. Place the MPU6050 board as flat as possible with the componentside up. Connect the board to an Arduino with an USB interface (see boardconnections in schematic HW_sensorboard_MPU6050). For calibration a separate Arduino Uno can be used or an HW_sensorboard_MPU6050 when e.g. an Arduino Nano is used on this sensorboard. Now run the calibration software (see software packages).
Display unit
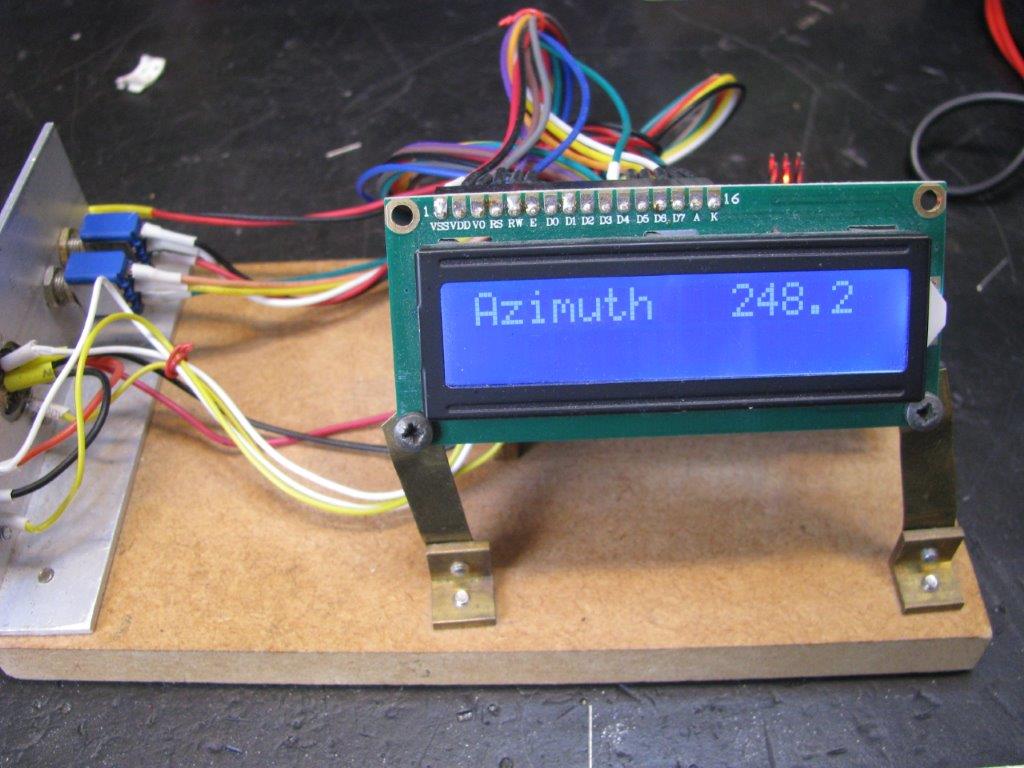
Examples of display units

The final display unit. Click on the photo to enlarge

Antenna display unit combined with GPS display. Click on the photo to enlarge.
Test tool
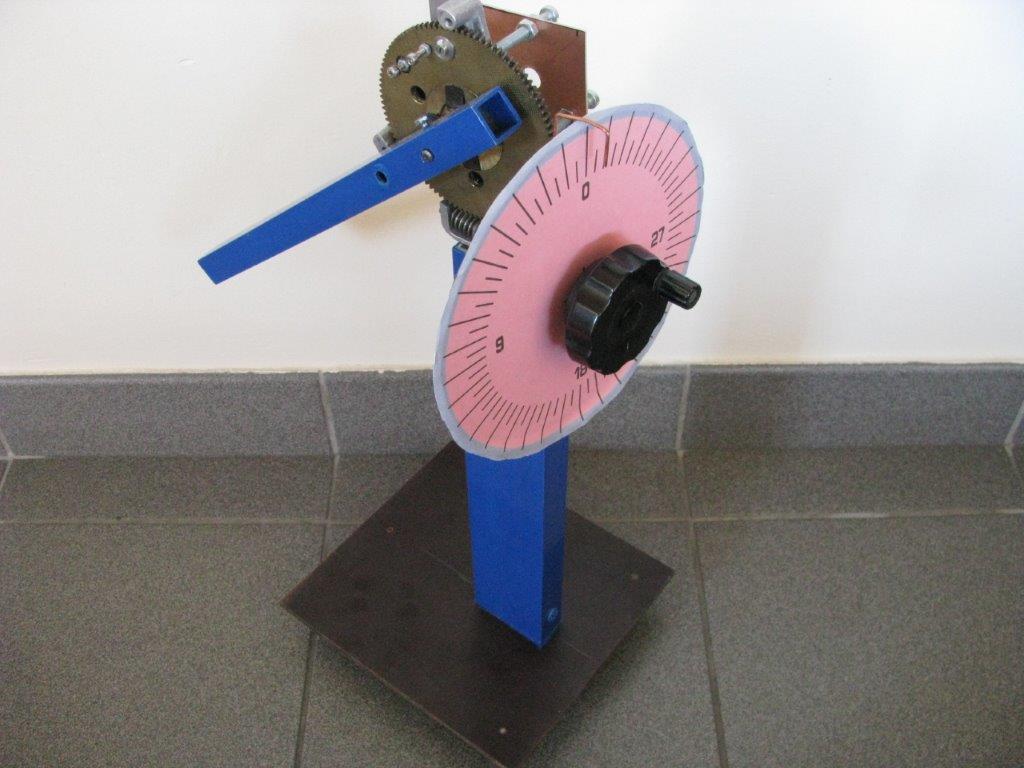
Tool for testing the accuracy. Click on the photo to enlarge
Robert, ON5SX (sk) made a tool for me for testing the accuracy of the Hall encoders and the elevation MEMS. Every rotation of the knob is 3.6 degree increment/decriment.
Accuracy measurements for MEMS MPU6050
| Mechanical reading (degrees) | Electronic reading (degrees) | Additional info |
| 0.0 | 0.0 | Date and time: 17/05/2021 18.22 UTC |
| 3.6 | 3.6 | Temperature: 22.9 degrees Celcius |
| 7.2 | 7.1 | |
| 10.8 | 10.7 | |
| 14.4 | 14.3 | The mechanical reading is quite precise, |
| 18.0 | 17.9 | nearly no backlash |
| 21.6 | 21.5 | |
| 25.2 | 25.0 | warming up time: 10 minutes |
| 28.8 | 28.6 | |
| 32.4 | 32.2 | Device: MPU 6050 |
| 36.0 | 35.7 | |
| 39.6 | 39.2 | calibrated at zero degrees |
| 43.2 | 42.8 | |
| 46.8 | 46.4 | |
| 43.2 | 42.8 | |
| 39.6 | 39.3 | |
| 36.0 | 35.7 | |
| 32.4 | 32.2 | |
| 28.8 | 28.6 | |
| 25.2 | 25.0 | |
| 21.6 | 21.5 | |
| 18.0 | 17.9 | |
| 14.4 | 14.3 | |
| 10.8 | 10.7 | |
| 7.2 | 7.2 | |
| 3.6 | 3.6 | |
| 0.0 | 0.0 | |
| -3.6 | -3.6 | |
| -7.2 | -7.2 | |
| -10.8 | -10.9 | |
| -14.4 | -14.5 | |
| -18.0 | -18.1 | |
| -21.6 | -21.7 | |
| -25.2 | -25.3 | |
| -28.8 | -28.9 | |
| -32.4 | -32.5 | |
| -36.0 | -36.1 | |
| -39.6 | -39.6 | |
| -43.2 | -43.3 | |
| -46.8 | -46.9 | |
| -50.4 | -50.5 | |
| -46.8 | -46.8 | |
| -43.2 | -43.3 | |
| -39.6 | -39.7 | |
| -36.0 | -36.1 | |
| -32.4 | -32.5 | |
| -28.8 | -28.9 | |
| -25.2 | -25.3 | |
| -21.6 | -21.7 | |
| -18.0 | -18.1 | |
| -14.4 | -14.5 | |
| -10.8 | -10.9 | |
| -7.2 | -7.3 | |
| -3.6 | -3.7 | |
| 0.0 | -0.1/0.0 |
Accuracy measurements for azimuth sensors MAB 25, ETS 25, HH-12
|
Azimuth Mechanical reading (degrees) |
MAB 25 Electronic reading (degrees) |
ETS 25 Electronic reading (degrees) |
HH-12 Electronic reading (degrees) |
| 0.0 | 0.0 | 0.0 | 0.0 |
| 18.0 | 17.9 | 17.8 | 18.1 |
| 36.0 | 36.0 | 35.8 | 36.3 |
| 54.0 | 54.0 | 53.9 | 54.6 |
| 72.0 | 72.0 | 72.0 | 72.6 |
| 90.0 | 90.0 | 90.1 | 90.6 |
| 108.0 | 107.9 | 108.2 | 108.4 |
| 126.0 | 125.9 | 126.2 | 126.2 |
| 144.0 | 143.8 | 144.2 | 143.9 |
| 162.0 | 161.6 | 162.0 | 161.7 |
| 180.0 | 179.6 | 179.8 | 179.6 |
| 198.0 | 197.6 | 197.7 | 197.5 |
| 216.0 | 215.7 | 215.7 | 215.6 |
| 234.0 | 233.8 | 233.8 | 233.7 |
| 252.0 | 252.0 | 252.0 | 251.9 |
| 270.0 | 270.1 | 270.1 | 270.0 |
| 288.0 | 288.2 | 288.3 | 288.0 |
| 306.0 | 306.2 | 306.4 | 306.0 |
| 324.0 | 324.2 | 324.3 | 324.0 |
| 342.0 | 342.0 | 342.1 | 342.0 |
| 360.0 | 0.0 | 0.0 | 0.0 |
Note:
- The reading accuracy of the test tool is fine, but the connection between the test tool and the measuring sensor is ‘reasonably good’ but the fit is not ‘perfect’. The measured values should therefore be read with some caution.
- The measurements were made on 1 specimen that was present here.
Note: an interface for the ETS25 SPI to serial (MAB25 or HH-12) protocol is described here: ETS25 SPI converter to serial
Electronic reading tools for MAB 25, HH-12, and ETS 25
Software
included in this software package:
software for display unit:
— SW_display_digital
— SW_display_analog
software for remote digital sensorboards:
— SW_sensorboard_HH12
— SW_sensorboard_MPU6050
software for calibrating MPU6050:
— SW_calibration_MPU6050
software for reading azimuth and elevation values direct (without sensorboard) from potentiometers:
— SW_display_direct_analog
software for remote analog sensorboard reading azimuth and elevation with potentiometers:
— SW_sensorboard_analog
Practical use of the sensor boards
[Best_Wordpress_Gallery id=”3″ gal_title=”AZ/EL G2″]
The developments of the Arduino sensorboards above are based on ideas from a team around F1TE. In principle the F1TE versions of the sensorboards can also be used in combination with the display unit above. The interface of the sensorboards is slightly different (mainly using other frame delimiters). Use the software here under for interfacing F1TE sensorboards.
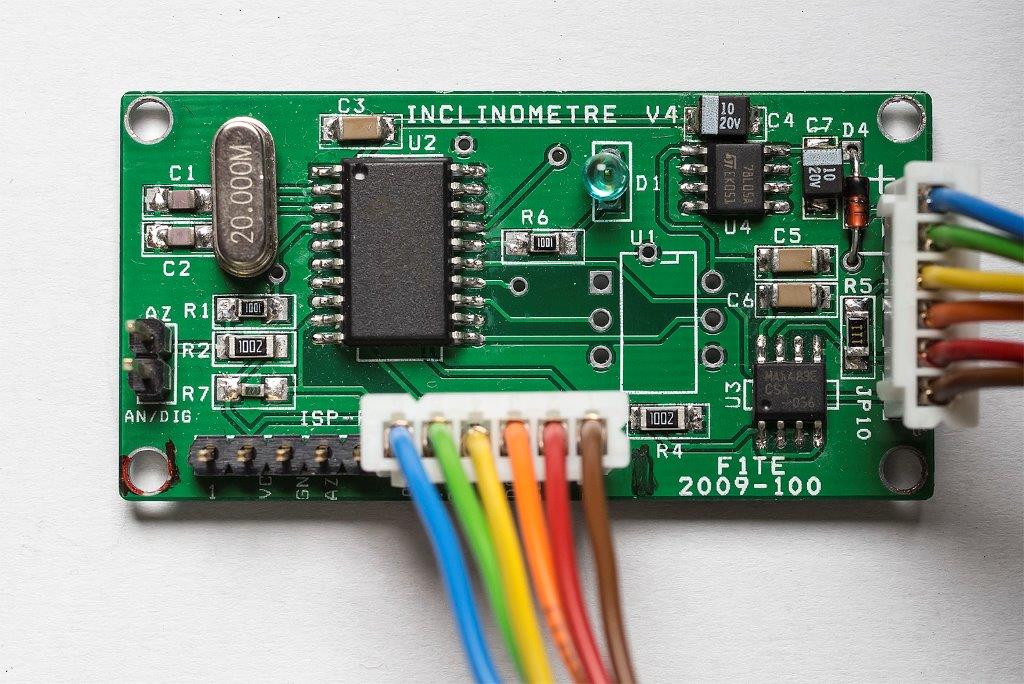
F1TE sensorboard (without elevation sensor mounted). Click on the photo to enlarge
Software for the F1TE Sensorboards (modified by ON4IY)
version with C0 delimiter hex file for sensor PCB with C0 delimiter (AZ only) and log file of data coming from sensor PCB
version with C1 delimiter hex file for sensor PCB with C1 delimiter (EL only) and log file of data coming from sensor PCB
version with C2 delimiter hex file for sensor PCB with C2 delimiter (AZ and EL) and log file of data coming from sensor PCB
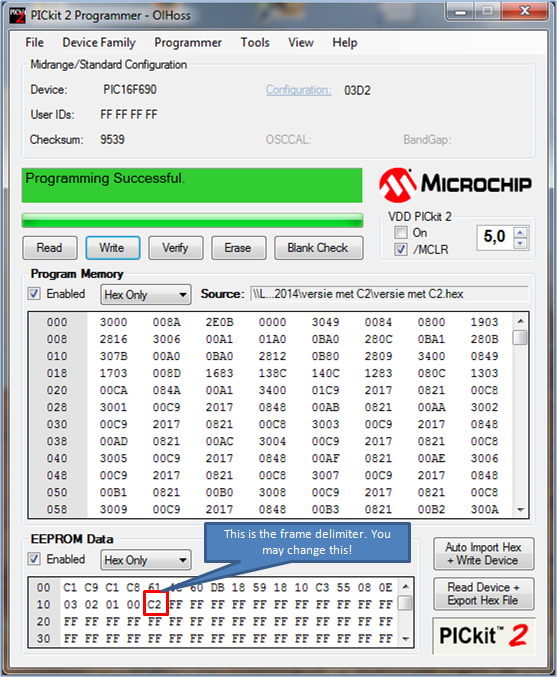
HEX file for sensor PCB – click to enlarge
Display unit
Display unit with the Arduino Uno or Nano
-
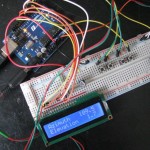
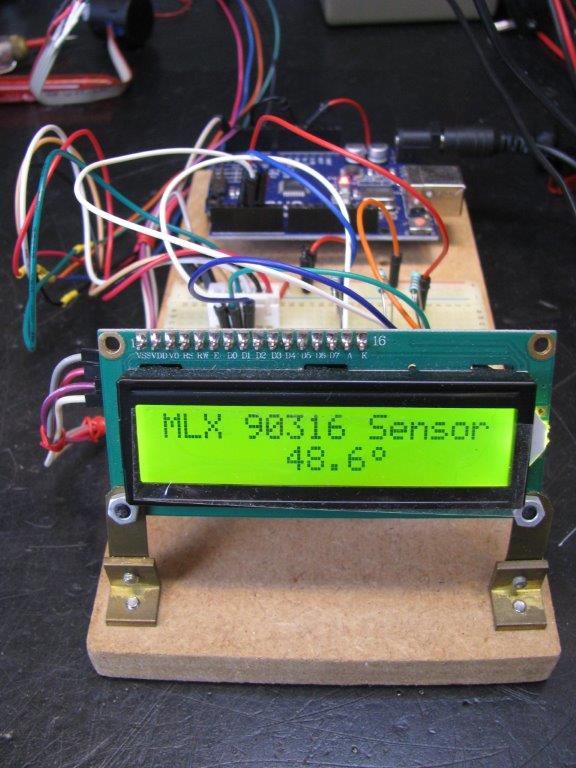
- Experimental set-up

-
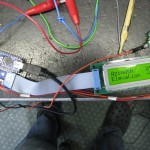
- Experimental set-up
-
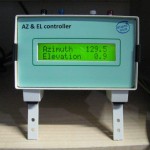
- The final display unit

The display unit used is the same as described above.
Software for the display unit interfacing F1TE sensorboards